Mid-Atlantic Opioid Task Force
Goal
Cluster analysis is an unsupervised machine-learning approach. In the context of this project, we attempted to create meaningful clusters of counties that could be used to (1) provide an informative description of the opioid epidemic as it pertains to Pennsylvania counties and (2) to provide a potentially valuable feature for the classification models for opioid survival or Naloxone administration.
Dataset
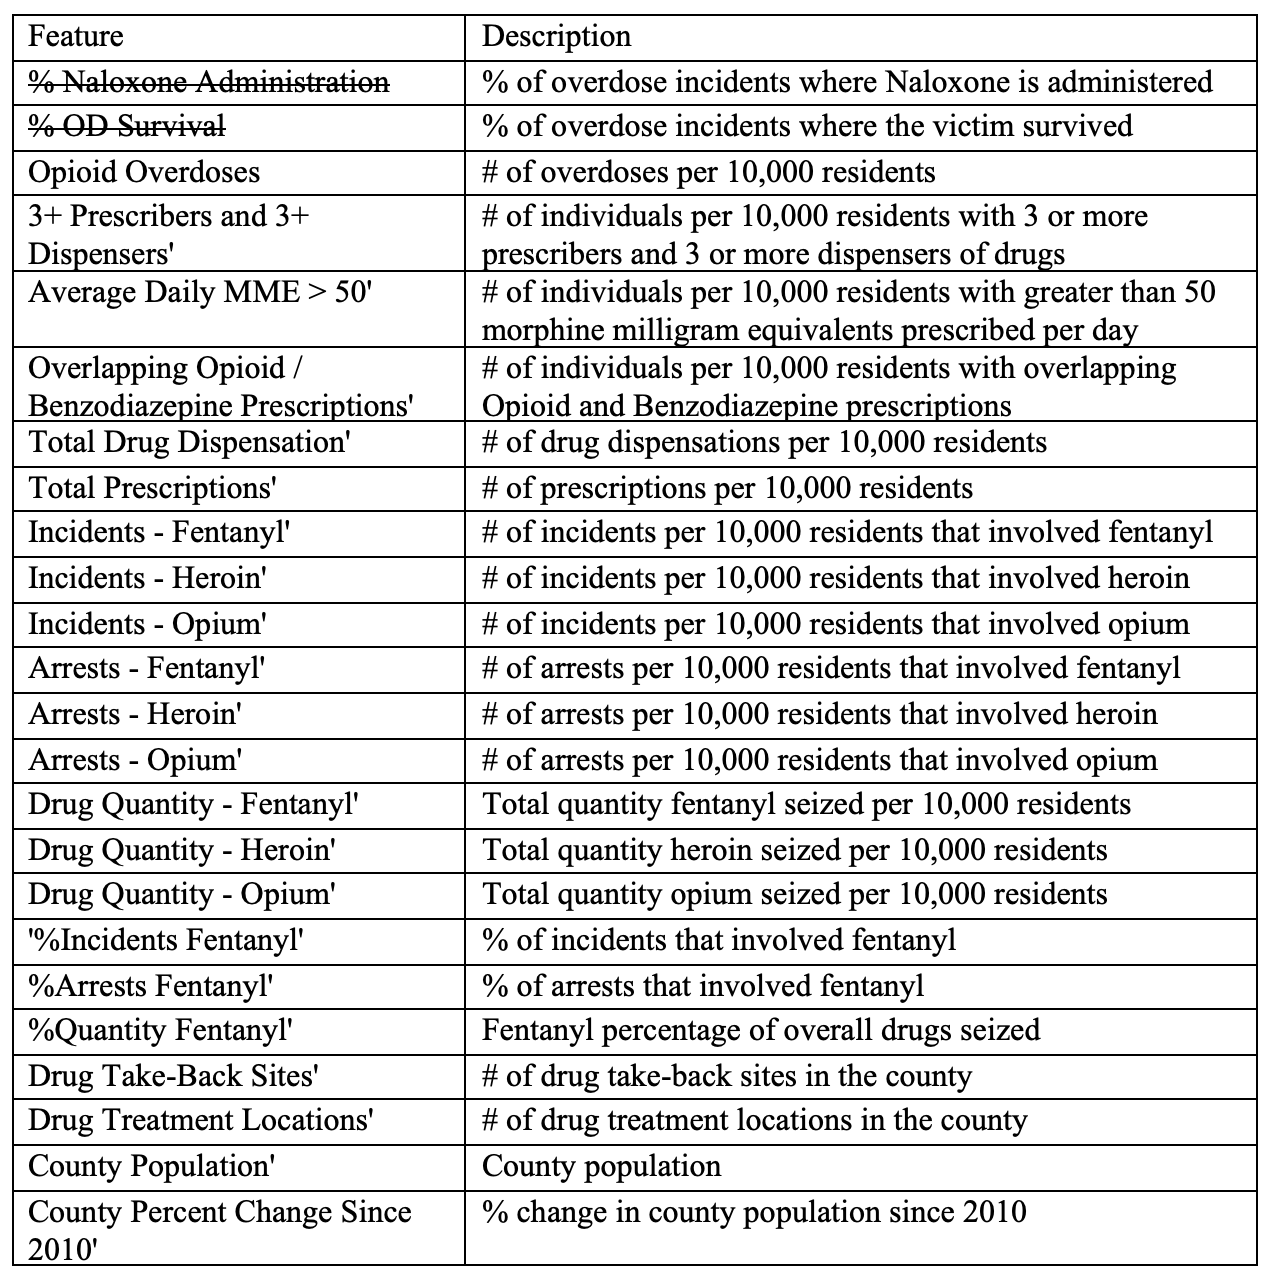
We performed cluster analysis on our county characteristics dataset. This dataset provides demographic and opioid related features at the county-level.
Pseudo-code
- DBScan
- Loop over each unvisited instance in the dataset:
- Mark the instance as visited
- Find all neighbors for the instance within a specified distance (eps)
- If # of neighbors is greater than or equal to the specified min # neighbors:
- Create new cluster C
- ExpandCluster(P, neighbors, C)
- ExpandCluster(P, neighbors, C):
- Add point P to cluster C
- Loop over each point in neighbors:
- Mark the point as visited
- Find all neighbors’ for the instance within a specified distance (eps)
- If # of neighbors’ is greater than or equal to the specified min # neighbors -> Join neighbors’ with neighbors
- If the point is not yet a member of any cluster -> Add the point to cluster C
- KMeans
- Create n singleton clusters (where each point is a cluster)
- Loop through following steps until centroid shift is less than some threshold:
- Assign each sample to the nearest centroid
- Create new centroids by computing the mean value of the points assigned to each centroid.
- Agglomerative Clustering
- Loop through following steps until centroid shift is less than some threshold:
- While the number of clusters is greater than some pre-specified number n:
- Combine the two closest clusters into a single cluster -->
Performance
- Our best clustering results were obtained with the KMeans algorithm with K=6. The clusters had a Silhouette score of 0.195 and a Calinski-Harabasz Score of 10.333. These scores are not ideal and indicate that the clusters are not well separated.
- Nonetheless, the resultant clusters did provide meaningful insight into survivability statistics with the various clusters showing significant variability in the percent of overdose incidents where the victim survived. The % Survival varied from 53.9% in Cluster 2 to 85.3% in Cluster 5.
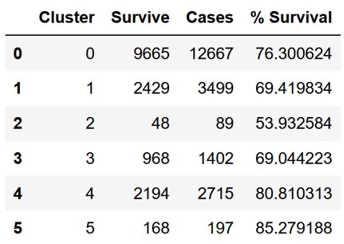
Fig.2 - Cluster Results - The other algorithms we explored gave poorer results, so the main limitation in clustering appears to be the dataset itself. Additional work on feature engineering and / or acquisition of new and features might result in better defined clusters.