Mid-Atlantic Opioid Task Force
Goal
Utilize machine learning in order to classify Opioid overdose incidents occurred in Pennsylvania.
Dataset
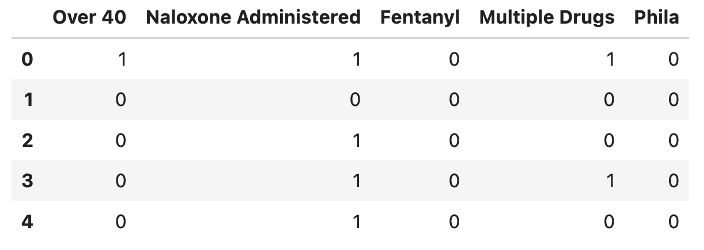
There are two classification models: one predicts survival, and another predicts Naloxone administration. Both models are similar, and therefore the input data is similar as well. Below are the features for the Survival classification model:
Pseudo-code
- Create dataset
- Split data
- Initialize pipelines with the desired estimators
- Fit pipelines
- Cross-validate using StratifiedKFold (sklearn)
- Plot threshold scores to find the best threshold (maximize both AUC and Matthew’s scores)
- Use that threshold to predict
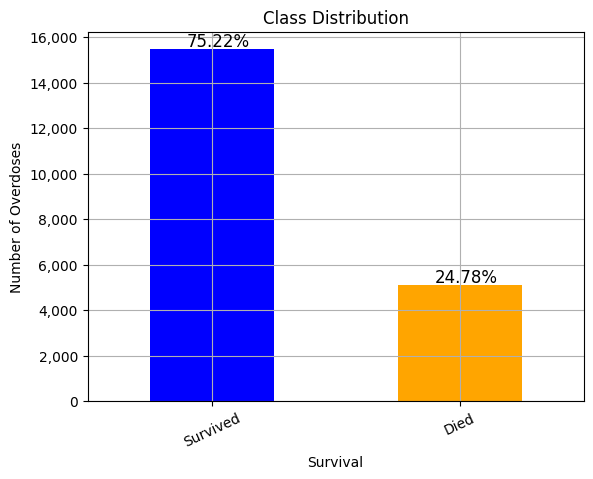
Class Balance
As can be seen below, the class is unbalanced, so class weights will be taken into account, as well as other evaluation methods such as ROC AUC and Matthews Correlation Coefficient.
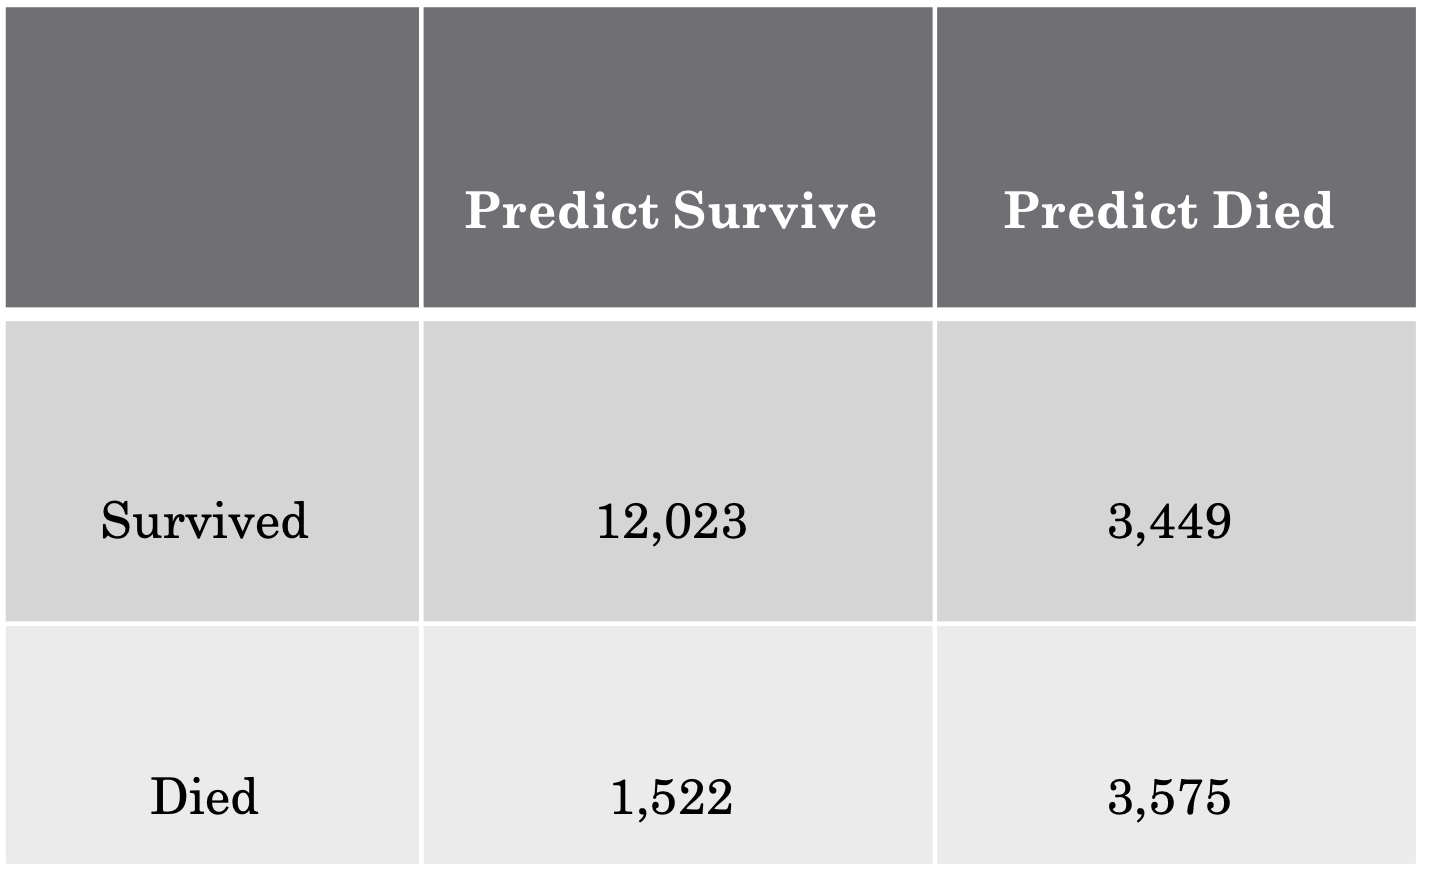
Baseline
Predicted survived if Naloxone was administered and there were no multiple drugs consumed:
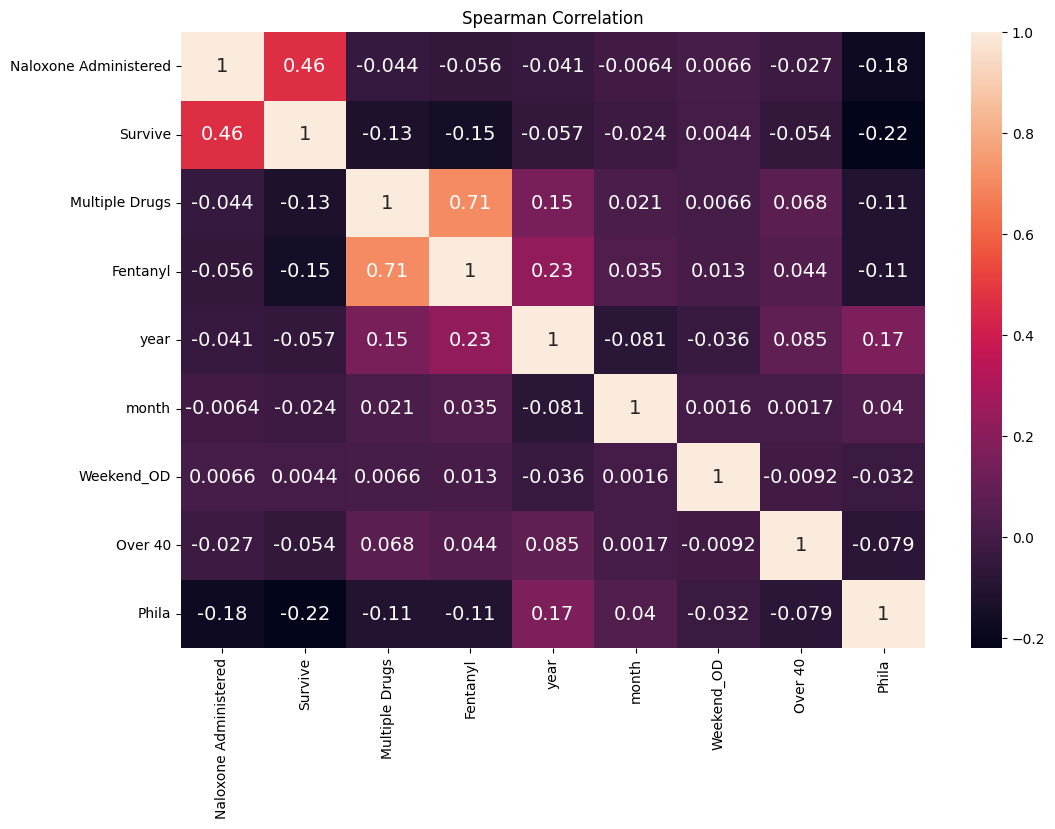
Correlation Heatmap
Used Spearman correlation and Seaborn package to draw a heatmap:
Methods
- Radom Forest’s allowed us to examine gini importance index which is excellent at interpreting how the model made its predictions.
- Logistic regression is a simple but powerful model that often provides reliable results.
- A Decision Tree model was used because of the ability to plot the individual steps that the model took to make its prediction.
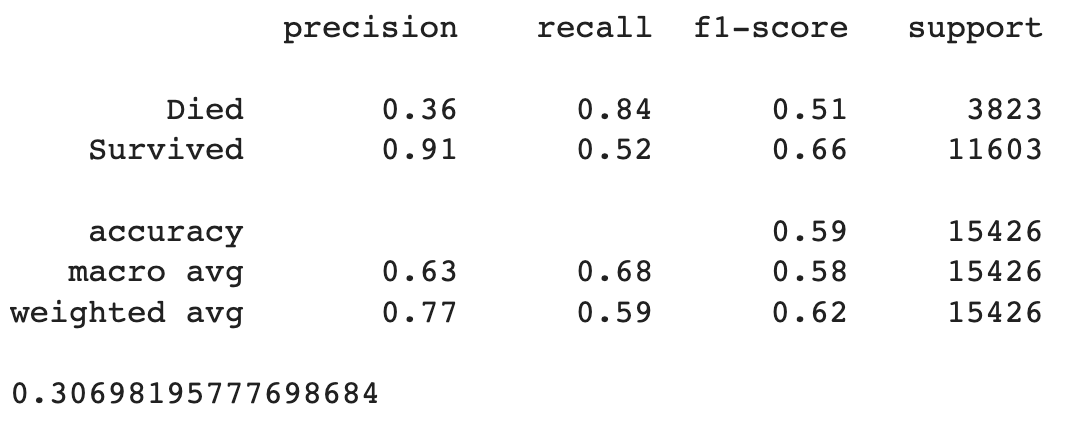
Performance
Created a graph that shows the AUC and Matthew's scores as function of the threshold. The graph was generated using a function, so it could be generated for any model we utilized. Below is the result of Random Forest:
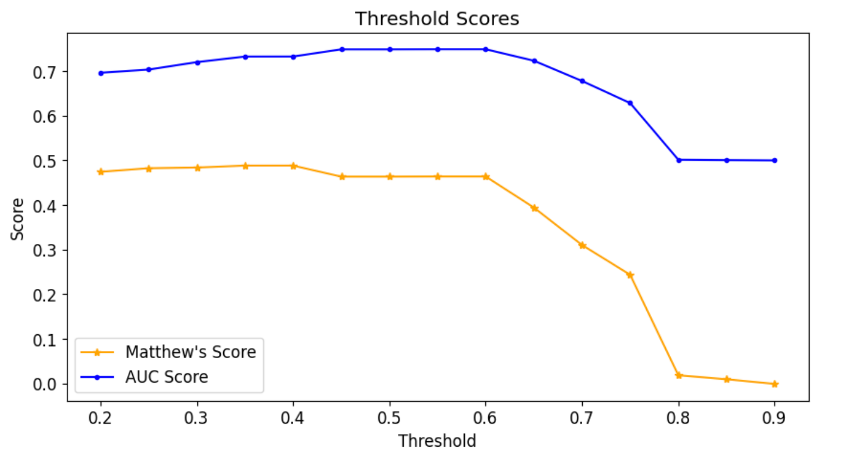
After choosing a threshold of 0.6, a manual iteration was done in order to maximize confusion matrix' results: